I've been thinking a lot about power lately. One of my favorite things! I needed to calculate power for some experiments we wanted to run at work and, as with all things, I was seized by existential doubt.
As a brief intro: statistical power is the likelihood of seeing an effect size when there is one. For those of you that like Type I/II errors, your power is your ability to minimize your Type II errors (false negatives). I think it might be fun to do a power walk-through (or power-walk through, heh), but I'll leave that for another day. For now, assuming you like stats and you like power, here are some thoughts on some stuff I've been reading.
Why we normally use power
Say you want to measure the effect of something. For example, what's the effect of textbooks on student learning (not much)? What's the effect of nearby job opportunities on parents' investment in their daughters' education (big)? What's the effect of Facebook on workers' productivity? Or of protein on a person's likelihood to commit a crime? Or whatever. I'm just making things up. There's lots of possible experiments out there.
To detect an effect size, you can go about things as a frequentist or as a Bayesian. We'll stick with the former for now, since that's what most people do. But a Bayes post - many Bayes posts - will come! I love Bayes. Anyway, under the frequentist worldview, you are faced with this reality:
- You can pull a sample from a population.
- If you pull a large sample, you'll probably be more likely to hit the population average. (See the law of large numbers.)
- But you could be unlucky and have pulled a crappy sample, whose average is way off the map.
- Anyway, you'll be working on a bell curve, which is convenient for the statistical tests you'll run. (See the central limit theorem.)
- In an experiment, you think you're pulling from two populations - your control population, and your treatment population. A population which has been unalterably changed by your experiment!
The first thing people usually ask is: so how big should our sample be? This is where power comes in. Power is the likelihood of detecting an effect when there is one (i.e. when there is a separate population you're sampling from, i.e. when things did change). It looks like this:
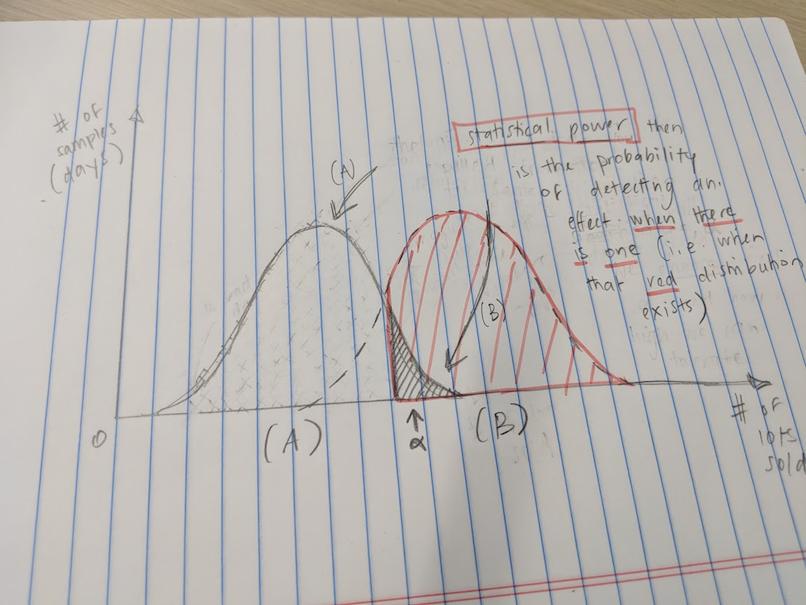
It's that red thing. The "industry standard" is power = 80%, so you solve your sample size for that. How you solve it depends on what you think the shape of those distributions are. For now, following the Wikipedia example walk-through, let's assume we're going to run a t-test of significance between two independently-pulled sample means, and we'll shoot for a 5% statistical significance level. In that case, the math would be:
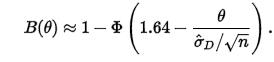
where
- \(B(1)\) is power
- \(\phi\) is the quantile function
- \(1.64\) is the t-value threshold for significance
- \(n\) is your sample size
- \(\hat{\sigma_{D}}\) is the standard error
Normally, you fix \(B = 0.8\) (for 80% power) and solve for \(n\). There's lots of online calculators and built-it methods in R (power.prop.test), Stata (power), and, for Python, the statsmodels.power module in statsmodels (docs).
Here's power for a simple A/B test:
def power_calc(minimum_detectable_effect):
    A_mean = data['column_of_interest'].mean()
    B_mean = A_mean * minimum_detectable_effect
    stat_sig_threshold = 0.95
    desired_power = 0.8

    print(f"Detecting any changes of {A_mean:.2f} -> {B_mean:.2f} and above.")

    std_effect_size = (B_mean - A_mean) / data['column_of_interest'].std()
    n_per_group = sms.TTestIndPower().solve_power(std_effect_size,
                                                   power=desired_power,
                                                   alpha=(1-stat_sig_threshold), ratio=1)

    return n_per_group
This returns the sample size per experimental arm (n_per_group). If you were running an A/B test, then you'd need to multiply that by 2 to get your total sample size needed. Generally, you maximize power by splitting cohorts up evenly, though you don't necessarily have to.
Why power can fail us
I read a super interesting blog from the Airbnb engineering team: Selection Bias in Online Experimentation: A Method for Winner’s Curse in A/B Testing. The tldr on it is that we tend to compound upward biases when aggregating cumulative effects over sequential experiments. In other words: don't add up wrong numbers! Or you'll get a very wrong number!
The blog went into some heavy stats/prob math, but my general intuition was: when we calculate power and hunt for significance, we often privilege large effect sizes. Note above that the minimum detectable effect size is just that: a minimum. If we were to observe a huge value in the B cohort, for example, the LLN/CLT would tell us that such an effect would be highly improbably random. In other words, it's probably an effect! What we then do (which is wrong) is take that point estimate as the effect size. In other words: big estimated effects are more likely to look statistically significant (and therefore "win") but may not actually be that big. The true effect might be there, just smaller. But we write down the big number. This is the "winner's curse": we favor big effects, since they satisfy our need for significance, and we miss small effects since they look insignificant.
Wonderful statistician/contrarian Andrew Gelman has a recent paper about this as well: Type M error might explain Weisburd’s Paradox (co-authors are Torbjørn Skardhamar and Mikko Aaltonen). He makes a convincing case that our quest for statistical significance and power calculations (especially ex post power calcs) - driven by a publication bias that favors positive, significant results - doom us to bias our effect size upwards. In the aggregate, as John Ioannidis would say, most research findings are false. But we can't even be sure, because most people don't even publish their data at all! Thus making meta studies even harder to do!
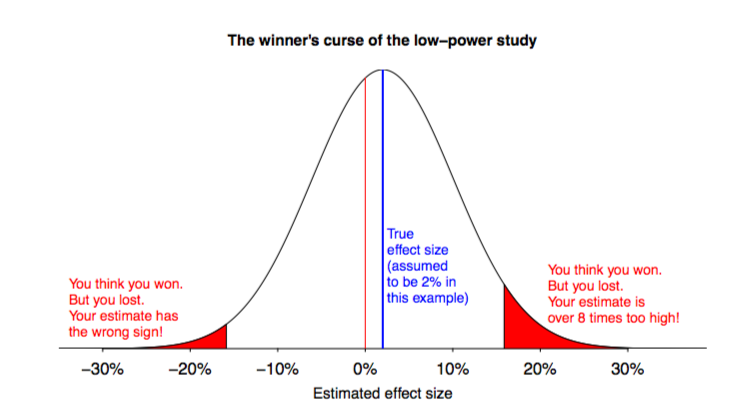 - Figure 1 from Gelman et al. 2017
Some other take-aways from Gelman's paper:
- They propose ditching the Type I/II error methodology/obsession, since it doesn't apply to studies that have non-deterministic, heterogenous outcomes (i.e. basically every study of human behavior). Instead, they discuss a new focus on Type S (sign) and Type M (magnitude) errors - i.e. minimizing getting things qualitatively and exaggeratedly wrong. The above figure is, I guess, how you'd go about determining those likelihoods.
- There is a thing called the "Weisburd paradox", which is that sample sizes have not actually been shown to improve power. (A replication study.)
Conclusion
The conclusion I always get from this stuff is that it's all lies, damned lies, and statistics! In other words, I'll do power out of interest and maybe even to build intuition, but - if I can - I'll trust something Bayesian instead.